If you had invested $100 in the S&P 500 in 1957 and reinvested every dividend, you'd have over $76,000 today. But is that extraordinary track record a result of genuine economic value creation — or is the index simply engineered to look like it always wins?

If you had invested $100 in the S&P 500 in 1957 and reinvested every dividend, you’d have over $76,000 today. But is that extraordinary track record a result of genuine economic value creation — or is the index simply engineered to look like it always wins?
Economy | May 2026
Did you know that if you had invested $100 in the S&P 500 at the beginning of 1957 and reinvested all dividends, your investment would be worth $106,494 by the end of 2025? That’s a total return of over 106,000%, or an annual return of 10.63%.
Adjusted for inflation, the picture is still remarkable — a cumulative real return of around 9,220%, or 6.79% annually. Nearly seven decades of wars, recessions, bubbles, pandemics, and political upheaval, and a hundred dollars became more than a hundred thousand.
Given that kind of track record, the question many investors keep coming back to is whether the S&P 500 is essentially designed to rise forever. And honestly? There’s a reasonable case to be made that it is —
What is the S&P500 Index?
The S&P 500, short for Standard and Poor’s 500, is widely considered one of the best indicators of the U.S. equities market. It tracks a representative sample of 500 leading companies across key industries in the U.S. economy.
The index’s history dates back to 1923 when Standard and Poor’s introduced an index of 233 companies. It evolved into its current form in 1957, expanding to include 500 companies — the version whose long-term return data we use today.
Below is a chart of the S&P 500 in real returns since 1957:
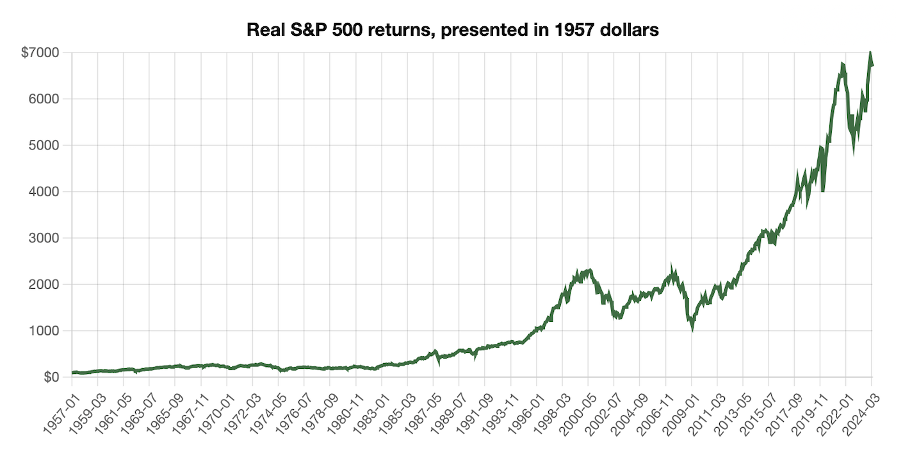
Source officialdata.com
Is the S&P500 index Biased to Rise Forever?
So the big question: is the S&P 500 constructed to rise constantly? Many will argue that it is. Let’s look at the three structural reasons that support that argument — and then tackle the complication that 2025 and 2026 have added to the story.
Economic Growth: driving towards prosperity
Imagine the index as a red convertible cruising along the open roads of the United States.
The driver is always looking ahead, adjusting based on expectations. The market anticipates future company performance and sets prices accordingly. And the baseline expectation, in most years, is growth.
The key indicator here is GDP — the total value of goods and services produced in a country over a given period. Historically, the U.S. economy has grown in the vast majority of quarters, with recessions representing relatively brief interruptions. Even after the COVID-19 shock of 2020, the economy bounced back sharply. Even after the tariff-driven volatility of 2025, which sent the S&P 500 down roughly 12% in just four days following “Liberation Day” in April before recovering to close the year up 17.9%, the underlying economy kept moving. The market followed.
That’s the point. The economy isn’t perfect, and neither is the index. But the long-term direction of a growing economy, growing population, and growing corporate earnings tends to be up — and the S&P 500 reflects that.
S&P 500 Rebalancing: fine-tuning for optimal performance
Think of index rebalancing as fine-tuning the convertible for optimal performance. Just as a car needs occasional maintenance and part replacements to run smoothly, the S&P 500 periodically adjusts its components.
New companies are added. Underperformers are removed. The index stays aligned with the evolving market. Done quarterly, this process ensures that the S&P 500 always reflects the current leaders of the U.S. economy — not the companies that used to lead it.
This is a genuinely powerful structural feature. It’s why the S&P 500 today includes Nvidia, Meta, and Alphabet at enormous weights, while companies like General Electric and Sears — once titans — have faded or disappeared from the index entirely. The index doesn’t mourn its losses. It replaces them and moves on.
That said, rebalancing has a limit that’s worth acknowledging in 2026. The Magnificent Seven — Apple, Microsoft, Nvidia, Alphabet, Amazon, Meta, and Tesla — now represent somewhere between 33% and 35% of the entire S&P 500 by market capitalisation. The top ten holdings account for over 40% of the index. What was once a broad representation of the U.S. economy now behaves more like a concentrated technology fund. Rebalancing works when the market is reasonably diverse. When a handful of AI-driven mega-caps dominate the index so heavily, the “fine-tuning” mechanism has less room to operate — and the index’s fate becomes unusually tied to the fortunes of a very small number of companies.
It doesn’t invalidate the long-term thesis. But it’s a real consideration for anyone investing today.
Growth Over Time: fueling the market’s journey
Real financial activity — sales, earnings, cash flows — is the fuel that actually moves the index forward over the long term.
When companies genuinely grow their revenues and earnings per share, stock prices tend to follow. And over the last two decades, despite two major crises, S&P 500 sales per share have trended consistently upward. As of December 2023, S&P 500 Sales per Share stood at $490.20 — and the trend into 2025 continued upward, with the index delivering three consecutive years of exceptional returns: +26.3% in 2023, +25.0% in 2024, and +17.9% in 2025.
Those aren’t outliers. They reflect a period of genuine earnings expansion, driven in large part by the AI investment cycle and the financial power of the companies at the top of the index.
What 2025 and 2026 Taught Us About the Brakes
The red convertible doesn’t only accelerate. Sometimes it needs to brake hard — and 2025 was a vivid reminder of that.
In April 2025, the Trump administration announced sweeping “reciprocal” tariffs on most U.S. trading partners. The S&P 500 fell 12% in four days. Consumer confidence dropped. Economists warned of recession. It felt, briefly, like the convertible had hit a wall.
Then the index rallied nearly 39% from its April low through year end, as tariff rates were walked back through trade deals and a temporary truce with China. The year closed up 17.9%. Within months, the fear had dissolved into a footnote.
In early 2026, a new correction arrived — this time driven by a combination of AI-sector jitters and geopolitical tensions that sent the index down roughly 9% from its January highs before recovering again. By April 2026, the S&P 500 hit new all-time highs and crossed 7,000 for the first time.
The pattern is consistent across decades: corrections happen, sometimes sharply, but the long-term direction of the index has always been to recover and reach new highs.
Summary — Why Should You Invest in the S&P 500 for the Long Term?
Three structural forces — economic growth, self-rebalancing, and genuine earnings expansion — create a system that is biased, over time, toward rising. Add in the influence of massive institutional buyers (pension funds, sovereign wealth funds, 401(k)s) and a growing global population that creates more consumers and more demand, and the upward tilt becomes even more pronounced.
The Federal Reserve’s mandate to support economic growth adds another layer. Monetary policy in the U.S. is explicitly designed to keep the economy expanding. That’s not a guarantee — but it’s a structural tailwind that few other asset classes enjoy.
The honest caveat for 2026 is the concentration question. When seven companies represent a third of the index, “diversified exposure to the U.S. economy” is a somewhat generous description of what you’re actually buying. Investors who are aware of this risk might consider equal-weight S&P 500 ETFs — funds that allocate roughly the same weight to all 500 companies, rather than putting nearly half your exposure in ten names.
But zoom out far enough, and the picture remains what it has always been. A hundred dollars invested in 1957 is worth over $106,000 today. The red convertible has been on the road for nearly seventy years, and it’s still driving.
Reflecting back, I wish someone had shared this insight with me when I was 20 years old.
Understanding the long-term power of the S&P 500 to reach new highs — despite corrections, crises, and the occasional four-day panic — is one of the most valuable things a young investor can internalize. The brakes get used. The engine keeps running.
In the end, the S&P 500 is still that red convertible: sometimes it has to slow down to navigate obstacles, but it ultimately keeps driving toward the sunset. Perhaps that’s always been the original intent — and the destiny — of the largest stock index of the largest economy in the world.
Disclaimer: The information provided in this article is for educational and informational purposes only and does not constitute financial advice. All investments carry risks, including the potential loss of principal. Always conduct your own research and seek advice from a qualified financial advisor before making any investment decisions.