

Gold started 2025 near $2,600 an ounce. By late January it had doubled to about $5,600, and as of early November 18 it is back at roughly $3,770. That is a round trip: gold has handed back about 60% of its run in under ten months, and it is still falling.
Here is our view in one sentence. Gold is giving back its run, and this time it is being sold like a stock instead of held like a hedge. The Fed gave sellers the reason, and the stock market gave them the push. This is analysis built on the numbers below, not a forecast.
Gold has given back about 60% of its run. It is down from about $5,600 in January to roughly $3,770, but still about 40% above where 2025 began.
The Fed set the direction. Rate hikes are beating inflation fears, which is why a hot inflation report pushed gold down instead of up.
Gold is trading like a stock. This year it has lost ground on the days the S&P 500 fell, the opposite of a safe haven.
Investors are raising cash. Losses in tech and AI stocks are pushing some leveraged investors to sell gold to cover margin calls.
More downside is likely, but a stock rebound can lift gold quickly. A lasting low probably needs the market to stop expecting more Fed hikes.
Why Is Gold Falling?
The mood on gold has turned in the last few weeks. Every rally gets sold, and the old reasons to own it have stopped working. The run to $5,600 pulled in a lot of buyers late, and the ones who bought near the top are now sitting on large losses.
Three things explain why the run is unwinding now, and each one makes the next one worse.
1. The Fed turned, and inflation stopped helping
Start with the part that looks backwards. Gold is the classic inflation hedge, yet hot inflation sent it down. October’s report came in above forecasts on November 10, and gold lost about 2% that day while stocks barely moved. Traders were not trading inflation. They were trading the Fed’s answer to it.
That answer has been hikes. The Fed raised rates in September, held on October 28 with two members voting for another increase, and as of November 18 traders see about a 95% chance of a quarter-point hike on December 9. The yield on 10-year inflation-protected Treasuries, which is the return on bonds after inflation, rose from 2.78% to 2.92% in the week to November 16. Gold pays nothing, so every rise in that return takes a little money away from it.
We have seen this before. In 2022 inflation hit a 40-year high and gold futures finished the year roughly flat, because the Fed was tightening hard. The dollar adds to it. The dollar index is above 103 as of writing, its highest since April 2025, and a stronger dollar makes gold more expensive for everyone who earns another currency.
Put simply, as long as the market expects the Fed to keep hiking, gold will keep reacting to higher yields and a stronger dollar, and even hot inflation will not help it.
2. Gold is trading like a stock
On October 30 the Nasdaq fell 2.9% on worries about AI spending, and the S&P 500 fell 1.8%. Gold, the asset that is supposed to cushion days like that, lost more than 3%.
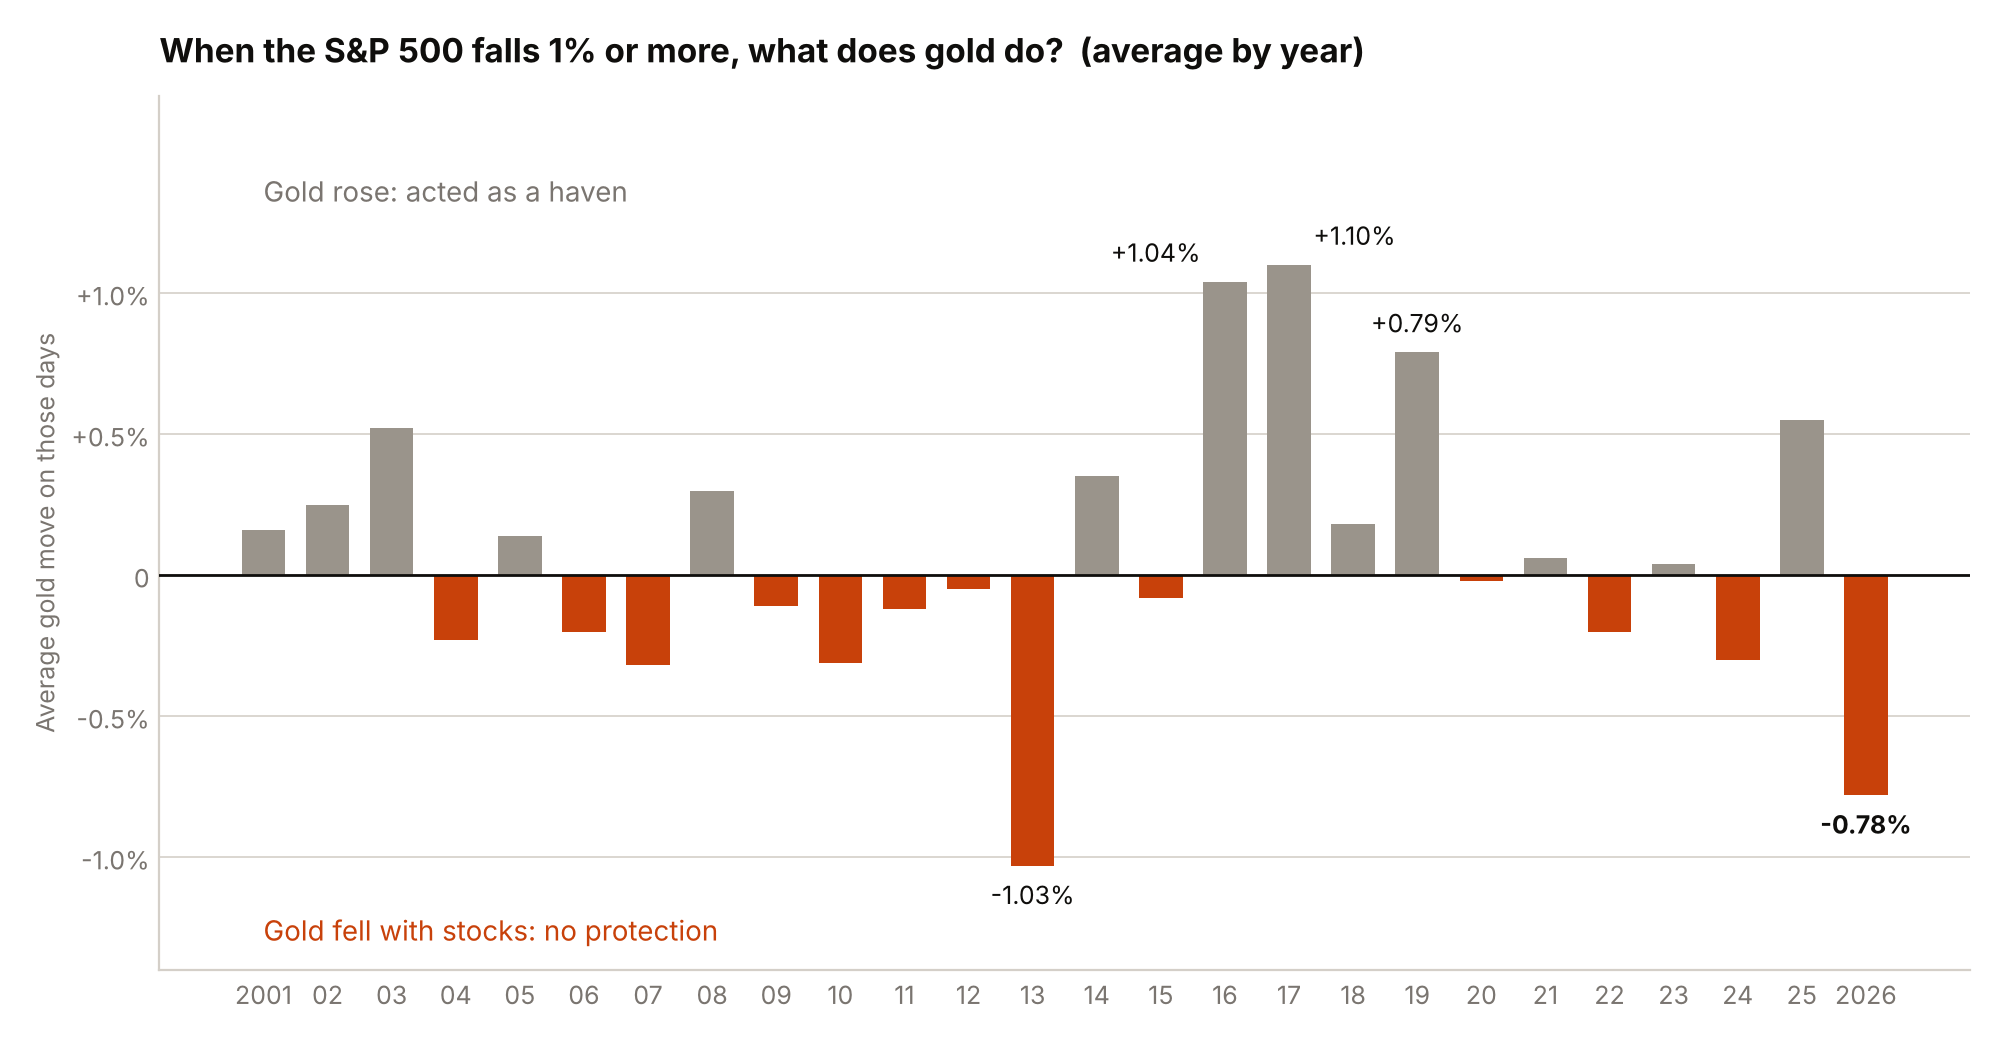
It has become a pattern. On days the S&P 500 fell 1% or more, gold lost 0.78% on average in 2026, the second-worst result since 2001. In 2016, 2017 and 2019 it gained between 0.8% and 1.1% on the same kind of day. Traders know this lockstep move as the everything rally, where assets that used to move on their own start moving together, and algorithmic funds trading the same signals have made it more common.
This is not a law of nature, and it does not happen every time. On November 5 the S&P 500 dropped 4.4% and gold rose 1%. But it is now the exception. Gold protects when the fear is about growth, and it gets sold when the fear is about rates, because rate fears hit stocks and gold together. 2013 was the same story, when the Fed started talking about pulling back its support.
The takeaway: with rates as the market’s main worry, gold is more likely to fall with stocks than to protect you from them.
3. Investors are selling gold to raise cash
Part of the story is simply cash. The sell-off in tech and AI stocks has left some leveraged investors and hedge funds scrambling for money. When losses on borrowed positions trigger a margin call, the broker wants more cash, and the investor sells whatever can be sold fast. Gold trades around the clock in deep markets, so it is often among the first things to go, even for people who like it.
That is what analysts pointed to on October 30, when stocks and gold fell together. Selling like this tends to be fast and tends to fade once stocks stop falling, which is why a stock rebound can lift gold again.
In a nutshell, each new leg down in stocks can bring another wave of gold selling, even from investors who would rather hold on.
Will Gold Keep Falling?
We think so, at least for now. The Fed is still tightening, the dollar is still strong, and losses in stocks are still pushing some investors to sell gold for cash. Investors are also looking for new sectors that can deliver high returns, a shift known as sector rotation that you can follow in our sector rotation tracker, and with the Fed hiking, gold is not the obvious place to look. None of that changes before the December 9 decision.
On the chart, gold lost $3,800 this week, a level traders had treated as a floor. RHB points to $3,600 and Kitco to $3,500 as the next stops. A full round trip to the $2,600 where 2025 began would be a much larger move, roughly another 30%. It would take a wave of forced selling, rising real yields and a Fed that keeps hiking all at once. We do not expect it, but it is the risk if the cash squeeze gets worse.
What Could Change the Sentiment?
The fastest change would come from the stock market. Gold is moving with stocks right now, so a rebound in equities can lift it too. We saw a small version in early November: the S&P 500 rose 1.6% on November 4 and gold jumped 3.4%. The bounce faded when the hot inflation report arrived on November 10, but it shows what a calmer stock market does for gold.
A lasting turn needs the Fed. In 2008 and in March 2020 gold sold off with everything else, and it recovered once central banks stepped in with easier policy. In 2022 it bottomed on November 3, right after the Fed’s last oversized hike of 0.75 percentage points and as traders began to expect smaller ones, then rose 26% by May 2023 while the Fed was still hiking. So gold does not need rate cuts. It needs the market to believe the hikes are about to stop mattering. Today traders expect the opposite.
There is also a floor of physical demand. The World Gold Council reports that central banks bought 321 metric tons in the third quarter, well above the five-year average of 227, and they care less about short-term swings than funds do. They will not stop a fall driven by funds, but they limit how far it can go.
So What Now?
Right now gold has very few reasons to rise. The Fed is leaning toward more hikes, the dollar is strong, and every stock market wobble sends another round of sellers its way. Unless the macro data changes or stocks bounce back, the easier path for gold is still down.
There is one scenario that flips the story. If stocks slide into a real crash, the fear in markets would move from rates to growth, and gold could go back to being the number one safe haven we all used to know. It did exactly that in 2016, 2017 and 2019. Even then, the first days of a crash can hurt gold, as they did in 2008 and March 2020, before the recovery starts.
The question for the coming weeks is simple: will gold go back to being the safe haven we knew, or keep trading like just another stock?
This article is opinion and analysis for informational purposes only and is not financial or investment advice. AllinAllSpace is not a licensed financial advisor. Investing in gold and other assets involves a high risk of loss, and forecasts may not come true. Figures are from Yahoo Finance (gold futures, S&P 500 and Nasdaq daily closes through November 17, 2026, and an early November 18 gold quote), CME FedWatch (November 18, 2026), the US inflation report released November 10, 2026, the World Gold Council (Gold Demand Trends Q3 2026, November 3, 2026) and analyst levels from RHB and Kitco, and are accurate as of November 18, 2026. Bad-day figures, 2022 figures and round-trip percentages are our own calculations and may differ from other providers. The view in the final section is our editorial opinion, not a recommendation.