
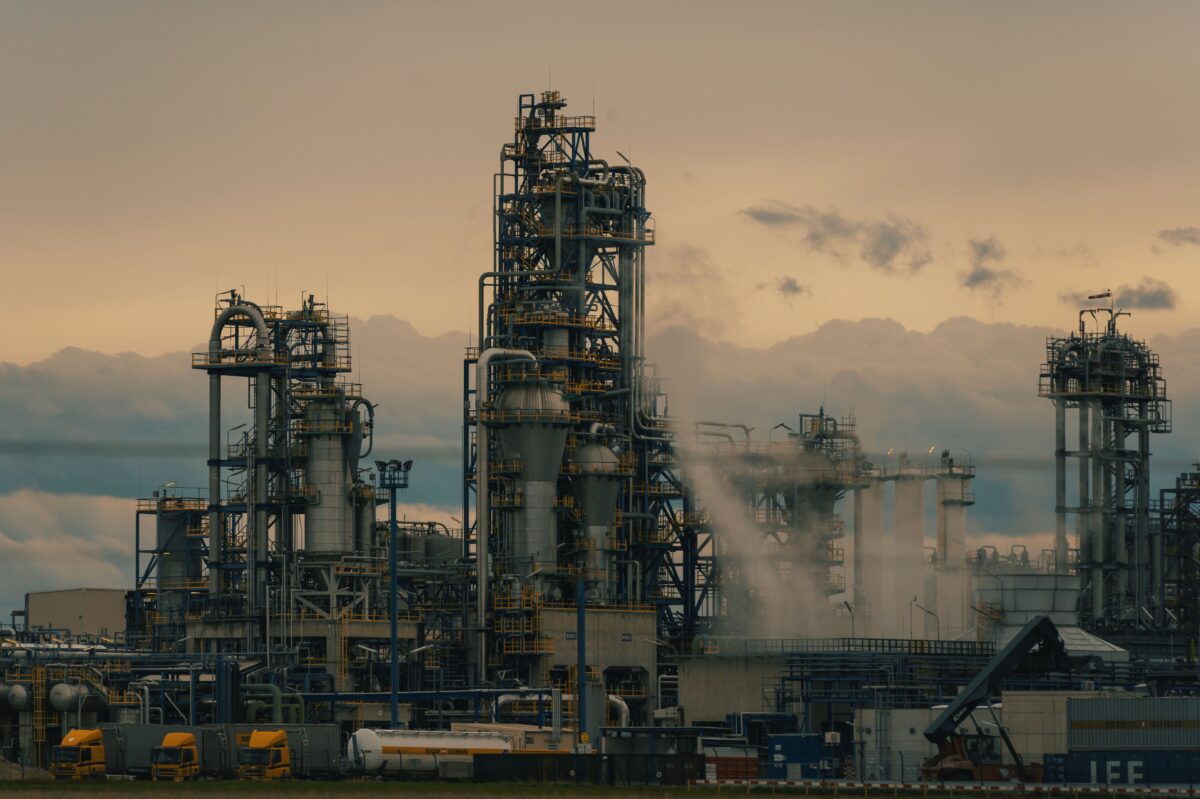
US natural gas has climbed about 10% in a month, from the high $2s to roughly $3.13 per million Btu, even after a pullback yesterday. That is a strange move for a market that keeps setting records for supply. US producers are pumping more gas than ever, the EIA expects output to reach new highs in both 2026 and 2027, and storage is still comfortable. So what is pushing the price up?
This piece asks which side of the market is really stronger, rising production or rising demand, and then looks at two outside forces that keep coming up in gas trading right now: the weather and the oil price, which is currently largely being driven by the Strait of Hormuz.
The chart shows the natural gas spot price. We could not get a Henry Hub futures chart, so its levels can differ slightly from the futures prices quoted in this article.
Supply or Demand: Which Side Is Winning?
The short answer is supply, and by a clear margin. Both sides are growing, and that is why the EIA’s October outlook talks about records for both. But the headline hides the fact that production is growing faster than demand. The table shows how much each piece is forecast to add from one year to the next, in billion cubic feet per day (Bcf/d).
| Change vs previous year | 2026 | 2027 |
|---|---|---|
| Supply: dry gas production | +4.6 | +3.9 |
| Demand: US consumption | +0.5 | +1.5 |
| Demand: LNG exports | +2.5 | +1.0 |
| Supply growth minus demand growth | +1.6 | +1.5 |
Source: EIA Short-Term Energy Outlook, October 6, 2026. Changes are calculated from the EIA’s unrounded figures, so rows may not add up exactly. Pipeline exports to Mexico and trade with Canada are not shown, so the last row is not a pure surplus.
The supply side. Production is forecast at 112.2 Bcf/d this year and 116.1 Bcf/d in 2027, up from 107.6 Bcf/d in 2025. The AGA says year-to-date output is nearly 4% above last year, led by the Permian and the Haynesville, and that output set a new daily record on September 17. The two basins grow for different reasons. The Permian produces gas as a by-product of oil, and the EIA expects it to reach 29.2 Bcf/d this year, 6% above 2025. The Haynesville is drilled for gas itself. The AGA reports gas-directed rigs up 15.4% from a year ago, and the EIA expects Haynesville output to grow 9% this year. That matters because gas drillers respond to price: a stronger Henry Hub tends to bring more supply.
The demand side. LNG is the big mover. The EIA expects exports to rise from 15.1 to 17.6 Bcf/d this year, which is most of the demand growth, and the AGA notes new capacity at Corpus Christi and a September record for pipeline exports to Mexico. Domestic consumption is the quiet part: the EIA has it up only about 0.5 Bcf/d in 2026. September looked stronger, with demand 5.0% above a year earlier and power-sector demand up 4.7%, according to the AGA, but that was a cooler September than last year, so some of it was weather and not a lasting shift. Our reading is that US demand is growing, and LNG is carrying most of the growth.
The verdict. Demand wins the headline, but supply wins the arithmetic. In both years production adds about 1.5 Bcf/d more than demand does, and that extra gas goes into storage or to Mexico. It is why inventories stay above the five-year average in most months of the EIA’s forecast, and why the EIA expects Henry Hub to average about $3.48 in 2026 and $3.16 in 2027, a fall and not a rally. When supply is the stronger side, a rally needs a specific reason to last, and that is what the next section looks at.
So Why Is the Price Rising?
If production is winning, why is gas up about 10%? The answer looks like a short-term supply wobble and a tighter storage picture, not a surge in demand.
Output has slipped from its peak. According to Trading Economics, Lower 48 output has averaged about 111.5 Bcf/d so far in October, down from record monthly highs of 113.3 Bcf/d in August and September. The same report links part of the drop to force majeure events and pipeline disruptions in Kentucky, Texas and West Virginia. A lower reading from a record high is enough to move a market that was already positioned for plenty of supply.
Export demand has recovered. LNG feedgas rose as Freeport LNG took more gas after a liquefaction train returned from maintenance. The AGA said September feedgas averaged 18.0 Bcf/d, up about 4.4% from August, as summer maintenance ended. Maintenance had held feedgas down in July, so the rebound adds fresh demand just as output softens.
Storage is tightening. The EIA now expects 3,850 Bcf at the end of October, which is 2% above the five-year average. In August it had expected 3,985 Bcf. The AGA reported that injections have come in below the five-year average build for seven weeks in a row, and stocks in the South Central salt region, which swing most with the weather, were 15.5% below their five-year average. Inventories are still comfortable, but the cushion is shrinking, and traders react to the direction as well as the level.
Put together, this is a price bounce driven by supply interruptions and a smaller storage surplus. It does not change the larger picture, in which production keeps growing faster than demand. If output returns to its earlier highs, the pressure on prices returns too.
The Weather Factor
Gas is a weather market. Cooler air means more heating demand, and gas generates about 40% of US electricity, so it also responds to summer heat and winter cold.
The near-term picture is mixed. The EIA expects October to be about 7% cooler than the 10-year average, measured in heating degree days, which supports demand at a time when the market usually expects very little. NOAA’s 8 to 14 day outlook for October 7 to 13 favours above-normal temperatures in the West and Florida and below-normal temperatures in the Northeast, with the central and southeastern US near normal, according to the AGA. Separately, Trading Economics noted that Tropical Storm Isaias was forecast to reach the Gulf Coast as a hurricane on Friday, October 9. Storms cut both ways: they can shut Gulf Coast production, which lifts prices, but they can also shut LNG terminals or knock out power, which removes demand.
The longer view is less supportive. The EIA expects November and December to be slightly warmer than average and the full winter to be about 3% warmer than the 10-winter average. That is a forecast, not a guarantee, and it is the biggest swing factor for prices. January 2026 averaged $7.72 after a major winter storm, which shows how quickly a cold spell can overwhelm a comfortable supply picture.
Oil, Hormuz and Why US Gas Stays Cheap
The Strait of Hormuz has shaped energy markets all year, and the global picture looks very different from the US one. The EIA assumes that oil flows from the Middle East stay constrained through the end of 2026, and it expects Brent crude to average about $105 a barrel in the fourth quarter, after $114 in September. Gas has been hit too. The Gulf region behind the Strait supplied about a fifth of the world’s LNG before the war, and according to Bloomberg, JERA’s chairman said on October 2 that he does not expect Qatari LNG back soon. Global spot LNG prices are roughly double their level a year ago.
Henry Hub has barely reacted. In July, when Kpler reported European gas near $21 and Asian gas near $22, Henry Hub settled at $2.93. Two things explain the gap.
The US can’t send much more gas abroad. To sell gas overseas, the US has to chill it into liquid form (LNG) at special export plants and load it onto ships. Those plants are already running almost flat out: they took in 18.0 Bcf/d in September, just under the April record of 18.8. So even though gas is far more expensive in Europe and Asia, there is little spare plant capacity to ship more of it, and the extra overseas demand never reaches US prices. That is our reading of the data, and new capacity at Corpus Christi and Golden Pass is what could change it.
Expensive oil creates more US gas. Much US gas comes out of the ground as a by-product of oil drilling, mainly in the Permian Basin. The EIA expects Permian gas output of 29.2 Bcf/d in 2026, 6% above 2025. WTI averaged $84 a barrel through July, against $65 in 2025, well above the breakevens of $69 in the Midland Basin and $63 in the Delaware Basin reported in the Dallas Fed survey. At those prices drillers keep drilling for oil whatever gas sells for, and the gas comes along for free. The AGA flags exactly this as a risk to watch: whether high Brent keeps supporting associated gas output.
That makes the oil link a two-way street. The Hormuz crisis lifts global gas prices and pushes up oil, but for Henry Hub the main channel is supply, not demand. High oil prices raise US gas production at the same time the export system cannot take much more gas. If Hormuz reopens and oil prices fall, associated gas growth would eventually slow, which helps the US balance, while lower global gas prices could reduce the pull on US LNG.
Natural Gas Price Forecast
Right now the price is being held up mostly by the weather. Cooler forecasts for mid-October and smaller-than-normal storage builds are keeping buyers active. Looking further out, the EIA expects Henry Hub to hold around $3.30 to $3.50 through the winter and then slip to about $2.64 in spring 2027.
| Henry Hub, $ per million Btu | Price |
|---|---|
| Today (October 9) | 3.13 |
| Q4 2026 (EIA forecast) | 3.30 |
| Q1 2027, winter (EIA forecast) | 3.47 |
| Q2 2027, spring (EIA forecast) | 2.64 |
| Full year 2027 (EIA forecast) | 3.16 |
Source: EIA Short-Term Energy Outlook, October 6, 2026. Forecasts are projections, not predictions, and the EIA revises them every month.
Why the EIA expects a fall. Production keeps growing, from 113.8 Bcf/d now to 117.8 Bcf/d by the end of 2027, which is more than rising LNG exports can absorb. Storage is expected to stay above its five-year average in most months, which limits how high prices can go.
Our view. The EIA already assumes a slightly warmer winter than normal, and the price still holds near $3.30 to $3.50. If winter turns out clearly mild, gas loses its main support while storage stays comfortable, which would give prices more reasons to fall in early 2027, possibly before spring. The risk runs the other way too. One severe cold snap can overwhelm all of this, as the last winter storm in January 2026 showed. Prices jumped to an average of $7.72 that month, so keep that in mind when trading natural gas.
What Could Change the Picture
Going by the general forecasts, natural gas is likely to stay firm over the next two to three months and then drop. But that is only the forecast. Traders should pay close attention to a winter that turns out cooler than expected, disruptions to storage, and a faster ramp-up at new LNG plants, which would add demand.
The pressure is likely to continue over the coming weeks, helped by cooler weather forecasts and smaller storage builds. Price can rise to the next key resistance level at $3.39, which is the most likely move from here.
After that, traders should closely watch the supply and demand figures and the weather forecasts. If nothing major appears by mid-winter, a drop back to $3 and below is likely.
This article is for informational and educational purposes only and does not constitute financial or investment advice. Natural gas prices are highly volatile and futures and related products carry a high risk of loss. Forecasts are projections and may not come true. Data sourced from the U.S. Energy Information Administration (Short-Term Energy Outlook, October 6, 2026), the American Gas Association (Natural Gas Market Indicators, October 1, 2026), Reuters via EnergyNow (July 28, 2026), Bloomberg via Energy Connects (October 2, 2026), Barchart via TradingView (October 7, 2026), Kpler Insight (July 24, 2026), and Trading Economics (October 8, 2026). Figures accurate as of October 9, 2026 and subject to change.