
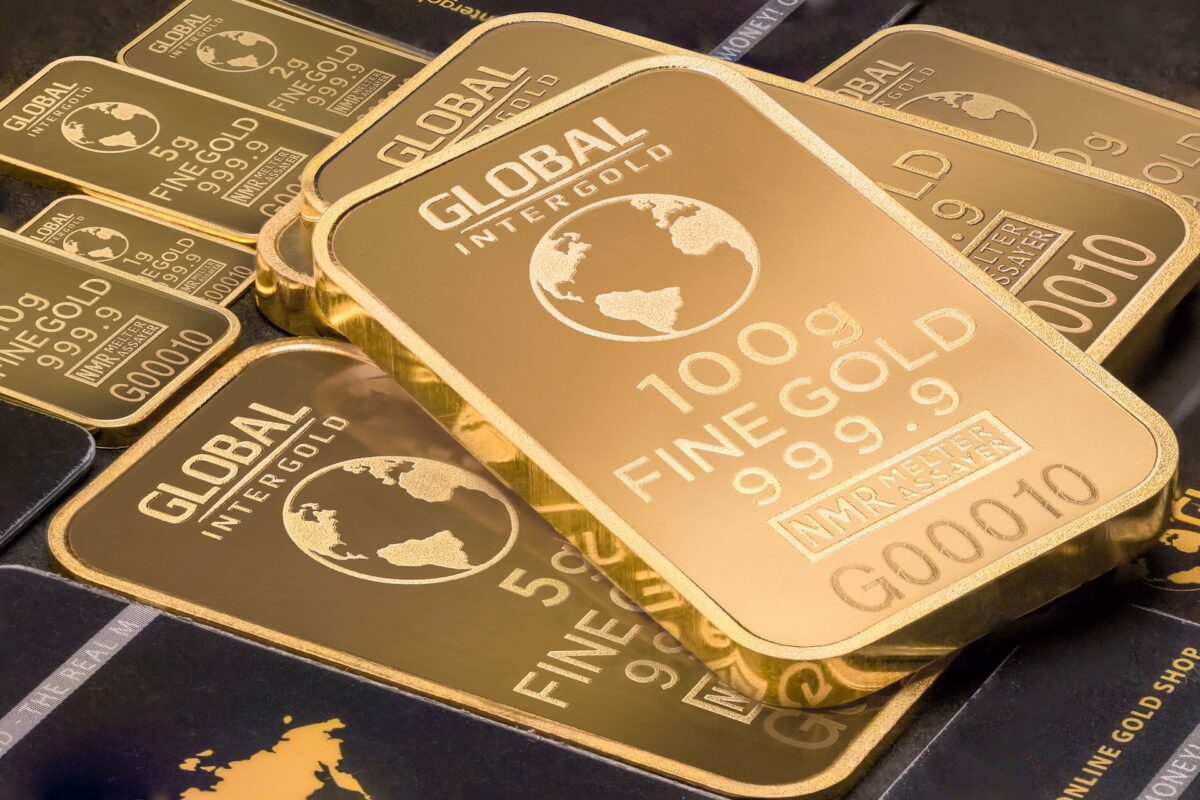
Gold hit $5,500 in January. Silver reached $120 following a historic short squeeze. Then, twice in six months, it all reversed. Gold is now trading around $4,100. Silver is at $62. Two crashes, different causes, similar confusion. This article explains both — what actually happened, why the paper market runs the show, and what the mechanics mean for where metals go from here.
The selloffs of 2026 are not the same story told twice. The first, in January, was a derivatives and liquidity event — mechanical, temporary, driven by the architecture of the options market rather than any shift in fundamentals. The second, running from May into July, is a genuine macro repricing tied to a shift in the rate narrative. One corrected quickly once the pressure cleared. The other requires the macro environment to change before it resolves. Understanding the difference matters a great deal if you are trying to decide what these prices mean.
How Far They Fell
First, the scale. These were not minor corrections. Gold’s Q2 2026 loss was its worst quarterly performance since the 2013 taper tantrum. Silver’s peak-to-trough decline from its October 2025 highs is nearly 50%. As our State of Energy & Commodities Q3 2026 report noted entering the quarter, precious metals had already delivered extraordinary returns — gold up 42% — which meant the positioning was stretched heading into a rate-sensitive environment.
To put those numbers in context: gold ETFs saw $5.3 billion in redemptions in June alone — the largest monthly outflow since 2013. Silver ETF holdings fell 13.4 million ounces between mid-May and mid-June, reflecting paper-position liquidation at scale. Bitcoin dropped 20.4% over the same period. On a risk-adjusted basis, gold actually outperformed both silver and crypto through the second crash, which tells you something about the relative resilience of the structural bid underneath gold.
Why Silver Fell Harder Than Gold
Silver’s deeper decline is not simply a matter of investor sentiment. It reflects a structural difference between the two markets that plays out every time metals sell off hard.
Silver has a dual identity problem. It is simultaneously a precious metal — bought and sold as a store of value and inflation hedge alongside gold — and an industrial metal, consumed in solar panels, electronics, and electric vehicles. When macro conditions turn against precious metals, silver gets hit by the monetary repricing and any concern about industrial demand simultaneously. It has no natural floor from central bank buying, which provides a consistent structural bid underneath gold that silver simply does not have.
Silver is also far smaller and less liquid than gold. The same dollar amount of selling moves silver prices far more aggressively. Citi estimated that index rebalancing in January required approximately $6.8 billion in silver futures sales — equivalent to 12% of all open interest on COMEX. That scale of selling, arriving in a thin market, moved the price regardless of what was happening in the physical market. To track how money is currently rotating across commodities, metals, and equity sectors in real time, our Sector Rotation Tracker gives you a live read on where institutional flows are going.
The physical fundamentals make this even more striking. The Silver Institute confirmed a sixth consecutive annual supply deficit in 2026. Industrial demand from solar and EVs continues to grow at 3–5% annually. COMEX registered silver inventories stood at approximately 82 million ounces in mid-June — a structurally thin buffer given consumption rates. And yet the paper price fell 22% in a single month. The physical market and the paper market are telling completely different stories, and in the short run, the paper market always wins.
Two Crashes, Two Different Stories
The most important thing to understand about 2026’s metals selloffs is that they had different causes. Treating them as the same event misses what actually happened and leads to the wrong conclusions about what comes next.
The Mechanical Correction
- Triggered by options expiry at end of January — the largest concentration of open interest in gold and silver options in years
- As gold fell through key technical levels, stop-losses on ETF positions triggered automatic selling, driving prices lower and triggering more stops in a cascade
- Index rebalancing by commodity index funds added $6.8B in silver futures selling — 12% of COMEX open interest
- Liquidity was thin: late January is historically one of the lowest-liquidity periods in metals markets
- European gold ETFs led the outflows — UK funds shed $1.9B in two trading sessions
- Physical demand did not collapse — the selloff was almost entirely paper-market driven, disconnected from fundamentals
- Recovery was rapid: gold bounced back toward $5,000 by March, confirming a positioning-driven event rather than a macro one
The Fundamental Repricing
- Triggered by a shift in the rate narrative — hotter-than-expected PCE data in May pushed September Fed hike probability materially higher
- Gold as a non-yielding asset becomes directly less attractive as real rates rise — one of the most reliable relationships in macro markets
- Energy-driven, supply-side inflation historically pushes gold lower, not higher — gold traded as an inverse oil proxy rather than a debasement hedge
- $5.3B in gold ETF redemptions in June — largest monthly outflow since the 2013 taper tantrum
- Western institutional demand repriced; Asian physical demand and central bank buying remained stable but insufficient to offset
- Silver fell harder: down 22% in June vs gold’s 11.7%, amplified by its dual precious-industrial identity
- Recovery slower: gold’s first weekly gain in five weeks came only after the June jobs report cut rate-hike odds significantly
Why COMEX Runs the Price, Not the Jeweller
Both crashes are impossible to understand without first understanding how the price of gold and silver is actually set — and it has very little to do with physical supply and demand in the short term.
The price of gold is determined primarily by trading in futures and options contracts on the COMEX exchange, part of CME Group. COMEX trades the equivalent of 27 million ounces of gold per day — 30 times the daily volume of the SPDR Gold ETF, which most people think of as the primary gold market. The flow of physical metal is dwarfed by this paper trading by an enormous margin.
This creates a structural disconnection. When investors want out — for any reason, macro or mechanical — they sell futures contracts. The futures market moves. The spot price follows. Physical demand, which may be rising or falling independently, is simply irrelevant to the price in the short run. The sixth consecutive annual supply deficit in silver is a real fact. The COMEX registered inventory level is a real constraint. And yet the paper price fell 22% in June. That is the paper market in action, operating entirely independently of physical reality.
The Options Mechanism Most Investors Miss
Options expiry is one of the most consistently misunderstood drivers of short-term metals price action, and it was central to the January crash in particular.
A gold or silver option gives the holder the right to buy or sell the metal at a specific price — the strike price — on a specific date. When a large number of options cluster around the same strike price, as they did in late January 2026 when open interest was unusually concentrated, the mechanics of options pricing create feedback effects in the spot market.
Options dealers who sell call options hedge their exposure by buying the underlying futures. As the price rises toward the strike, they buy more futures. As the price falls away, they sell. This process — called delta hedging — means that large concentrations of open interest create gravity around certain price levels and then amplify moves once those levels break. In January, when gold fell below key strike prices, dealer hedging required them to sell futures. That selling drove the price lower. Lower prices triggered stop-losses on leveraged ETF positions. Those stop-losses sold more futures. Each layer of selling fed the next. What looked like a dramatic market collapse was largely a mechanical cascade driven by the architecture of the derivatives market, not by any fundamental change in the gold outlook.
The Correlation Break
One of the striking features of the second crash is that it happened while equities held up relatively well. The S&P 500 pulled back modestly, but metals crashed. This broke the pattern that defined markets through most of 2024 and 2025, when stocks and precious metals moved together — a correlation driven by algorithmic trading and risk-on/risk-off dynamics where everything rallied or fell simultaneously.
We wrote about that structural shift in detail in The Everything Rally: How Algo Trading Made Markets Move as One. The algo-driven correlation was real and well-documented. But it was always vulnerable to an idiosyncratic macro shock — which is exactly what hit metals in May and June 2026. A rate outlook that was specifically bad for non-yielding assets, without being bad enough to reprice equities significantly, broke the correlation in one direction.
The same dynamic showed up clearly in sector rotation. While metals were selling off, capital was rotating into rate-sensitive equity sectors and defensive names rather than out of equities entirely — the kind of nuanced shift our Sector Rotation Tracker captured in real time as the move developed. The June PCE data did not rattle equity investors broadly. It repriced the rate path in a way that targeted non-yielding assets specifically, and metals bore the brunt of it.
Gold’s rate sensitivity is one of its most reliable characteristics. As real rates rise, the opportunity cost of holding a non-yielding asset increases directly. Investors can earn meaningful returns on Treasury bills. Holding gold, which earns nothing, becomes relatively less attractive. That relationship held true in June regardless of what algorithms were doing on any given day.
What Five Institutions Said After the Crash
One of the more notable features of the second selloff was the speed with which major financial institutions published bullish responses to it. Within days of gold testing its lows, five institutions published research defending the long-term bull case. Their conclusions pointed in the same direction: the selloff changed the entry price, not the thesis. It also worth noting that the same AI-driven capital concentration that our AI bubble analysis flagged as a systemic risk was part of why the rate repricing hit so many asset classes simultaneously — when highly correlated, leveraged positions unwind, they tend to take everything with them, including metals that had no fundamental reason to sell off at those levels.
The four-month selloff reflects the repricing of rate-sensitive Western demand — not a change in who is buying gold. Central bank and Asian physical demand remain intact. The bank maintained its target after the crash.
Gold lost 11.7% in June — its steepest monthly decline since the 2013 taper tantrum. Despite $5.3B in ETF redemptions, total holdings remain well below pandemic-era peaks. $4,000–$4,100 seen as firm support. Institutional positioning is not stretched.
Gold responded correctly to energy-driven, supply-side inflation, which historically pushes gold lower. The debasement trade is in suspension, not dead. On silver: the January high above $120 can be revisited — but only after gold makes new all-time highs first.
Mid-Year Outlook “Point Break”: gold crossed $5,500 in January, fell below $4,000 by late June, still down 7% YTD but among the top commodity performers over 12 months. Asian physical markets now play a direct role in price discovery — a structural difference from the 2013 correction.
The two crashes of 2026 are a useful case study in how modern commodity markets actually work. The January crash was almost entirely mechanical — a derivatives cascade that had little to do with whether gold and silver were fundamentally overvalued. The fact that prices recovered quickly and completely was confirmation of that. Investors who sold in a panic in late January and watched gold return to $5,000 by March have a lesson worth internalising.
The second crash is different in kind. Rate repricing is a real, fundamental force. The opportunity cost of gold rises when real rates rise. That relationship is as reliable as anything in macro markets. But the corollary is also true: when the rate narrative softens, gold tends to recover, often sharply. The June jobs report — 57,000 payrolls against a forecast of 110,000 — produced a 2% gold bounce in a single week. The market is highly sensitive to any hint of a pivot.
The structural story has not changed. Global debt hit a record $353 trillion in H1 2026. Central bank accumulation continues on sovereign mandates that do not respond to quarterly CPI prints. The Asian physical bid, which was absent in the 2013 correction, is now a real and persistent force in price discovery. The six consecutive annual silver supply deficits do not disappear when futures traders sell. At some point, the physical and paper markets have to reconcile. The question is when — and nobody can answer that with confidence.
What is clear is that understanding the mechanics matters as much as understanding the macro. In 2026, the metals market proved once again that the price on your screen is set primarily by a derivatives market that trades 30 times the volume of the physical market, responds to rate expectations as quickly as to physical supply, and is structurally vulnerable to mechanical cascades at options expiry. That is not a reason to avoid metals. It is a reason to understand what you own and why — and not to confuse a derivatives event with a change in the underlying story.
What to Watch
The two crashes resolved differently and will continue to do so. January’s mechanical selloff cleared as soon as the options expired and the index rebalancing completed — a matter of weeks. The second crash is tied to the rate path and requires a macro shift to reverse meaningfully.
The primary catalyst to watch is US inflation data. Any meaningful softening in CPI or PCE readings that brings September rate-hike odds back down would be the single most powerful driver of a metals recovery. The weak June jobs report showed exactly how sensitive the market is to any pivot signal — a single data point well below expectations produced a 2% single-week gain in gold. If the data continues to weaken, institutional targets in the $4,900–$5,800 range over 6–12 months do not look unreasonable.
For silver specifically, watch the COMEX registered inventory level and the gold-silver ratio. The ratio compressing back below 65:1 would signal silver beginning to outperform again. Physical coin and bar demand is already responding to lower prices — forecast at a three-year high of 227 million ounces in 2026, up 20%. That physical absorption is not moving the paper price today, but it is tightening the physical market in ways that will eventually matter. For the broader commodity context — where oil, copper, and grains sit relative to metals right now — see our State of Energy & Commodities Q3 2026 report.
This article is for informational and educational purposes only and does not constitute financial or investment advice. Prices and data are accurate as of July 6, 2026. Sources include the World Gold Council Mid-Year Outlook 2026, State Street Global Advisors July Gold Monitor, Goldman Sachs commodities research, MKS PAMP metals strategy, Silver Institute World Silver Survey 2026, Kitco/CPM Group, CME Group, Citi commodities research, and Investing.com. Always conduct your own research before making any investment decision.